1 Introduction
This chapter gives an introduction to machine learning.
Readings: ISLR
- Chapter 1 Introduction
- Chapter 2.1 What is Statistical Learning
Data Set Website Kaggle: https://www.kaggle.com/datasets
What is Statical Learning?
- very similiar to machine learning
- way of finding patterns in data through methods
- gaining information from data
- develop accurate model to predict and estimate an output on the basis of a couple of predictors
- difference between prediction and inference as two approaches to data, can be mixed
Data analysis goals:
- Description: What happened?
- Who will win the election?
- Why are women underrepresented in STEM degrees?
- Prediction: What will happen?
- Is the climate changing?
- Explanation: Why is this happen?
- Why is the climate changing?
- Prescription: What should we do?
- What is the best way to prevent heart failure?
Modes & Examples:
- Exploratory: Following your gut or other criteria to some interesting results
- Description: EDA; unsupervised learning
- Prediction: supervised learning
- Explanation: John Snow and 1854 cholera outbreak
- Prediction: Personalized medicine
- Confirmatory: Testing hypotheses
- Description: One sample t-test
- Prediction: macroeconomics
- Explanation: causal methods
- Prediction: A/B testing
Different objections in Data Science and Economics for estimating the function of Y
Data analysis: estimating a model f to summarize our data, composed of an outcome Y and a set of predictors \(X:\hat{Y} =f(\hat{Y})\). Two main reasons to estimate f.
- Prediction: X observable, Y not, Prediction of Y on the basis of an estimated function. \(\hat{Y}\) as the estimated prediction of a resulting prediction for Y.
\[ \hat{Y} =\hat{f}(X) \]
- Inference: Understanding the association between Y & X1, …. Xp. We wish to estimate f, without making predictions, so \(\hat{f}\) is not treated as a black box, it is exact known. Which predictors are associated with the response? Which predictors are improtant? What is the relationship between X & Y? Is the relationship linear or more complicated? Inferenzstatistik, Inferenzparadigma.
The accuracy of \(\hat{Y}\) for Y depends on reducible and irreducible error. First can be reduced using the most appropriate statistical learning technique. irreducible because of the error term, that has variability \(0\), because this one include unmeasured variables that are useful in predicting Y with not measurable variation.
only the reducible error can be minimized by the right techniques, keep in mind, always irreducible error, which is unknown!
Data science: mostly interested in prediciton, so in \(\hat{Y}\).
Empirical research /economics: mostly interested in inference (i.e., explanation): understanding the relationship beween X and Y → linear regression.
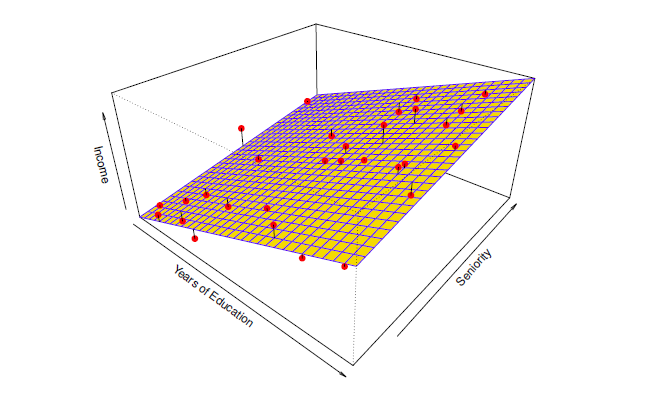
1.1 Parametric Methods
Reduces the problem of estimating f down to an estimating set of parameters. Two steps:
- f is a linear of x (choose a parametric form)
\[ f(X)= \beta_0 +\beta_1 X_1 + \beta_2X_2 + \dots, \beta_pX_p \]
- now, you have to estimate the parameters, the \(\beta\) with the train data, that fits a model.
\[ Y \sim \beta_0 +\beta_1 X_1 + \beta_2X_2 + \dots, \beta_pX_p \]
Most used method: ordninary least squares. Mostly a linear model. Has the problem, that often linear models can´t grasp the entirely abitrary funktion f
→ address this problem with more flexible models, but requires a greater number of parameters → problem of overfitting data, which means the model follow the errors / noise too closely.
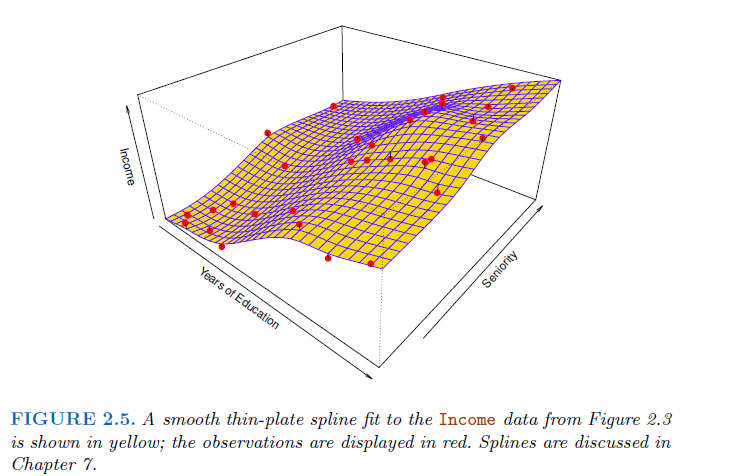
1.2 Non-parametric Methods
No explicit assumptions are made for the f. No predictors are collected beforehand. They have the freedom to choose any functional form from the training data. As a result, for parametric models to estimate the mapping function they require much more data than parametric ones. Instead seek an estimate of f that gets as close to the data points as possible without being too rough or wiggly. → advantage is a more accurate fit for a wider range of possible shapes for f. → disadvantage is, that far more observations are necessary to estimate an accurate f. Most used method: thin-plate spline with a selected level of smoothness, that defines the level of roughness to the fit.
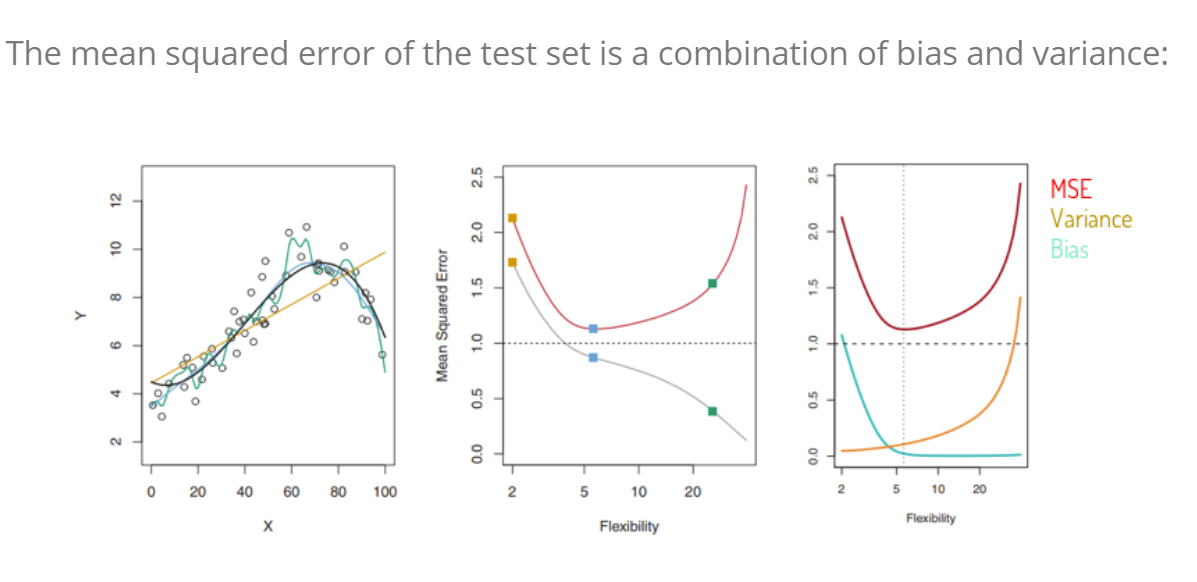
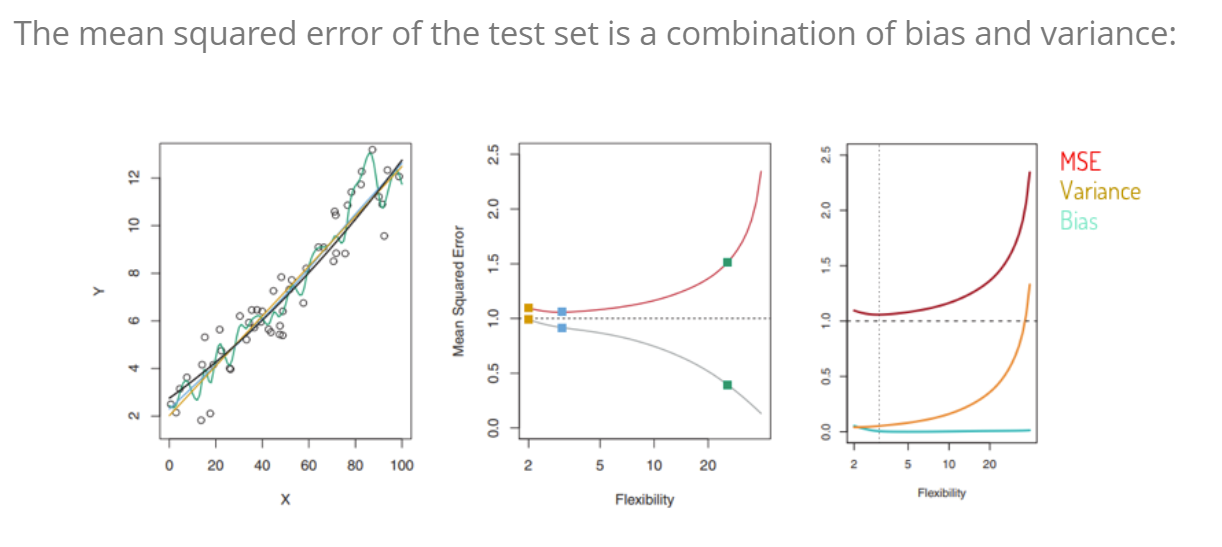
1.3 Model accuracy vs interpretability
Deep Learning is 90 % Blackbox, 10 % is not. It is not obvious, what happen, because there are multiple, thousands of coefficients. We see the input and the outcome, but we can not figure out the certain coefficients and parameter. Many methods have different levels of flexibility, means how many parameters are estimated. Linear regression for example really inflexible, the thin plate splines are much more flexible. High model complexity in it means high flexibility! Area of conflict between Interpretability and flexibility and methods in this area:
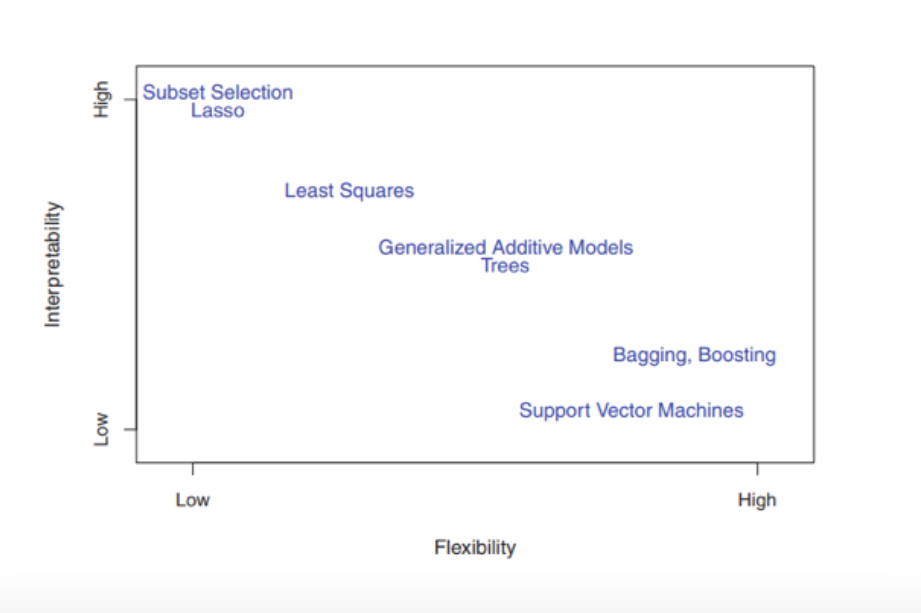
Which model is adequate depends on the research subject. Not always is a very flexible approach the preffered one. A linear model, which is more restrictive,is very adequate for inference, because it is more interpretable. → with a restrictive model it is easier to understand the relationship between \(Y\) and \(X_1, X_2, \dots, X_p\). With a flexible model it is really difficult to understand how any individual predictor is associated with the response.
- lasso relies on a linear model, but uses an alternative fitting procedure for estimating the coefficients, less flexible approach than linear regression, because a number of parameters set to zero.
- GAM or generalized additive models allow for certain non-linear relationships
- bagging, boosting, support vector machines and neural networks (deep learning) are fully non-linear methods.
How can we measure the accuracy of a model?
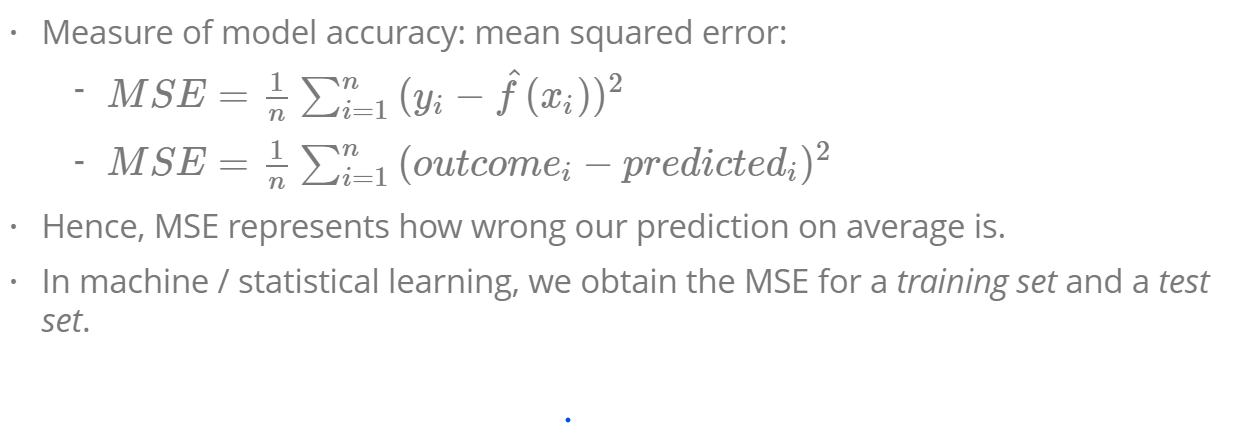
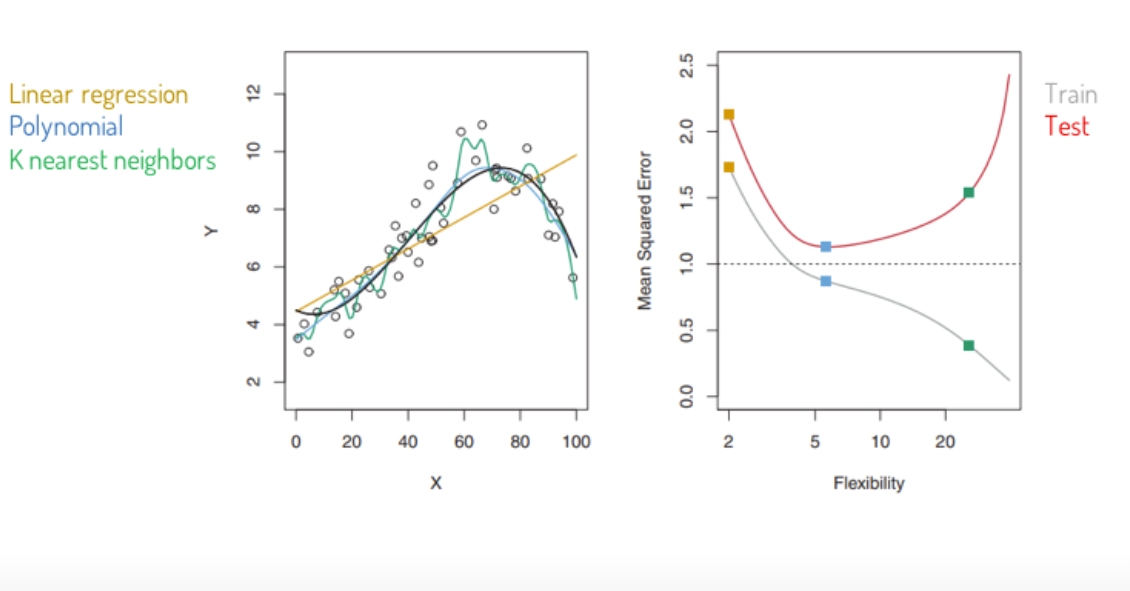
We should stay by 5 to 7 predictors in the flexibility/ complexity, because otherwise the model is overfed.
Bias trad off variance:
1.4 Methods to find patterns and relationsships
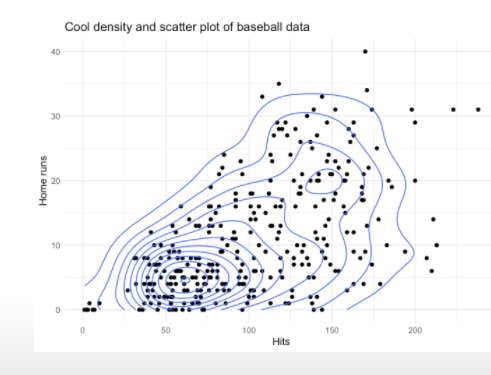
Explorative data analysis
Describing interesting patterns: use graphs, summaries, to understand subgroups, detect anomalies (“outliers”), understand the data
Examples: boxplot, five-number summary, histograms, scatterplots…
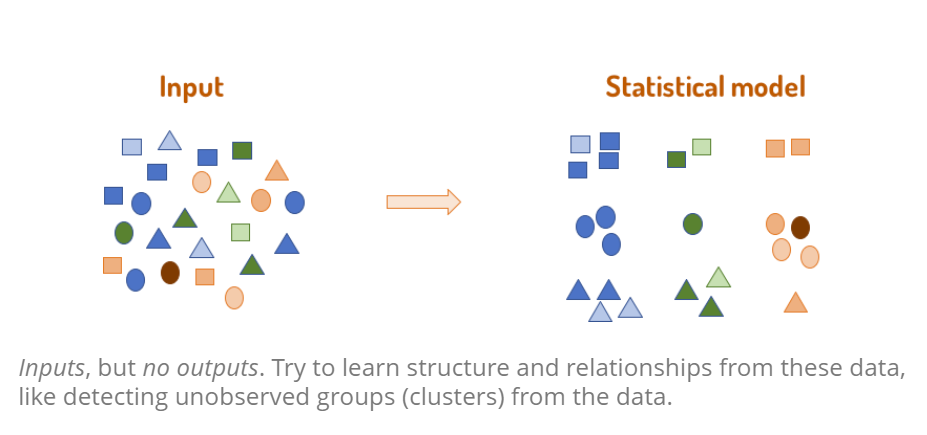
1.4.1 Unsupervised learning
Inputs, but no outputs. Try to learn structure and relationships from these data, like detecting unobserved groups (clusters) from the data. For every observation there is a measurement in x, but there is no associated response y_i, there is no response variable to predict → we are working blind, no response variable to supervise the analysis.
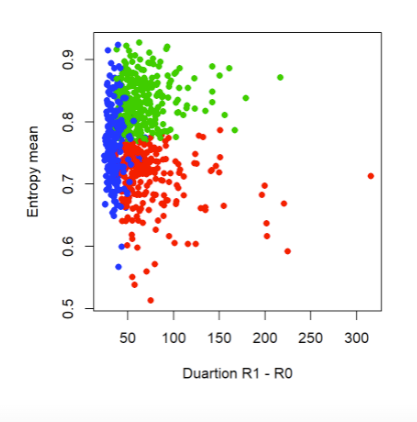
For detecting relationships between variables and observations → finding clusters in data
- on the basis of \(x_1, \dots, x_n\) in which relatively distinct groups fall the observations.
Dimension reduction methods:
- Principal components analysis
- Factor analysis
- Random projections
Clustering:
- K-means clustering
- Hierarchical clustering
1.4.2 Supervised learning
Building a statistical for predicting/ estimating an output based on one or more inputs. The output is predefined: Is it this or that? What outcome should be generated?
For each observation of the predictor measurement is an associated response measurement \(y_i\). On this basis a model is searched to accurately predicting the respones for future observations (prediction) or better understanding the relationsship between the response and the predictors (inference).
Examples:
- Spam Classification of e-mail
- face recognition over images
- medical diagnosis systems for patients
Methods include:
- (logistic) Regression
- decision trees/ random forests
- support vector machines
- neural networks
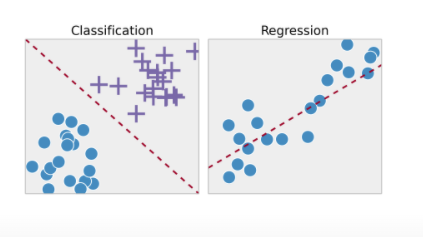
supervised learning: classification vs. regression:
Classification:
predict to which category an observation belongs (qualitative, categorical outcomes) -> cancer: yes or no?, a boy or a girl?
Regression:
predict a quantitative (continuous outcome) -> money, weight, amount of rain
semi-supervised learning problem:
Sometimes not that clear, if supervised or unsupervised learning is the better solution. This is the case, if we have more observations with predictor measurements and a response measurement than observations with measurements only.
Here statistical learning is used to incorporate both kind of observations.